Lecture: Visualization
Contents
In this course, you will learn how to design effective and interactive data visualizations for abstract, predominantly numerical data sets.
Students will create an interactive visualization for a dataset of their choice, you can find some of the examples from previous years below.
Detailed module description.
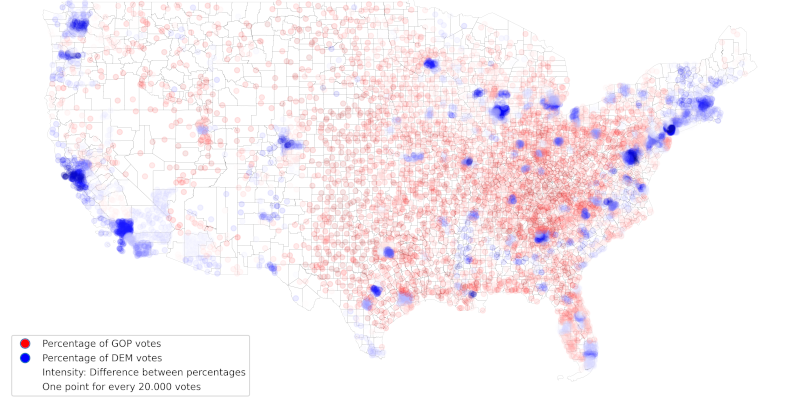 Visualization on Geographic Maps
 Scientific Visualization
Example Projects
 Leander Gerwing: Football scouting tool
 Paul Hufnagel: Game Development Studios
 Patrick Lang: League of Legends World Championship Visualization